ATLAS
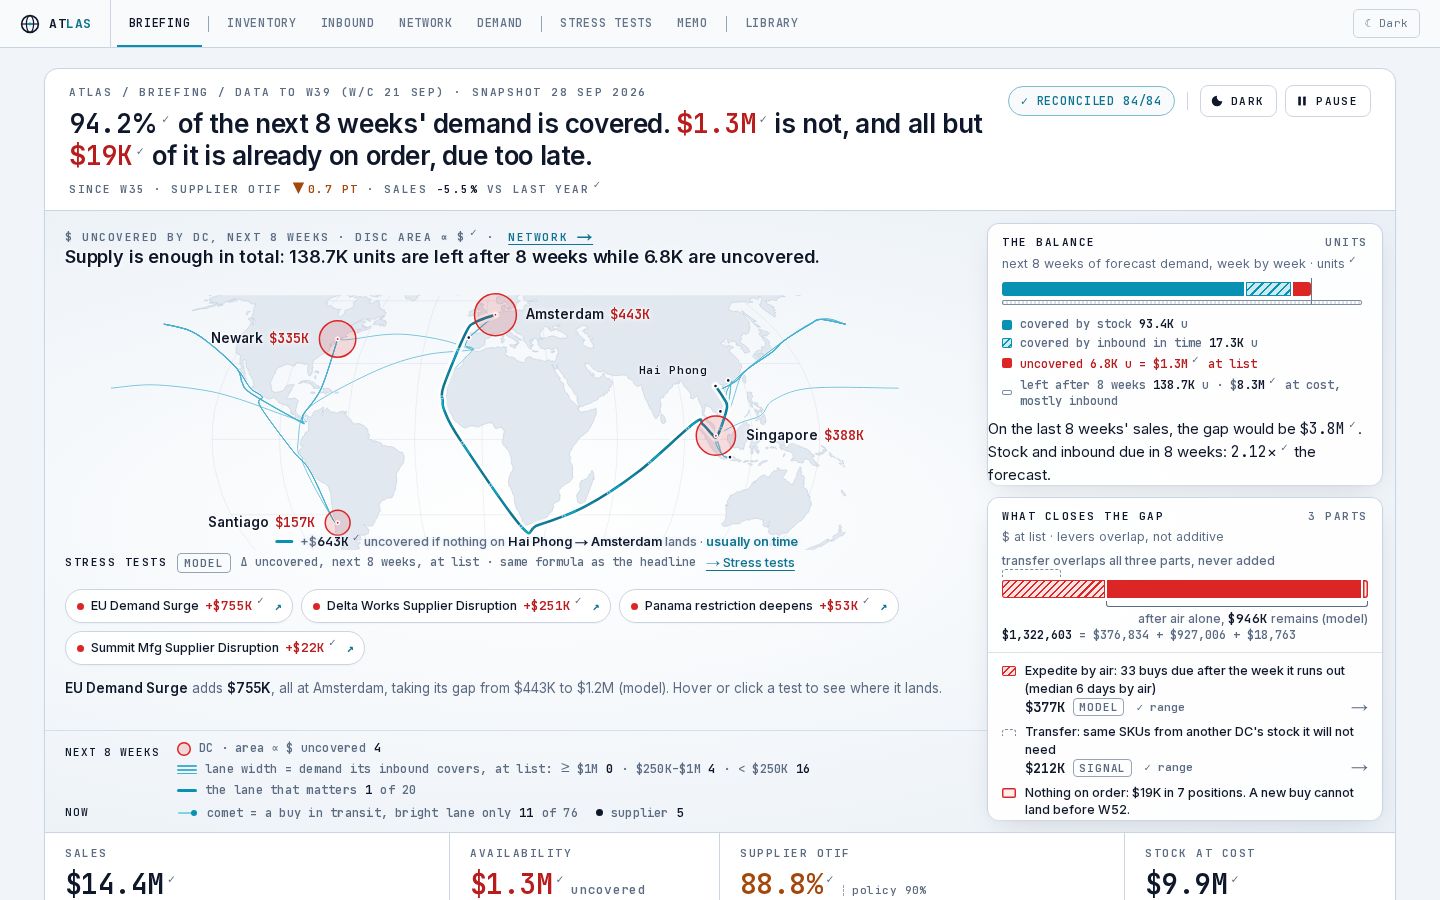
Synthetic data, fictional companyA supply-chain control tower for a fictional footwear brand: stock coverage, inbound orders, demand and stress tests, with every figure checked and traceable.
Open the live demoWork
All of these run on synthetic data for fictional companies. They show how I approach a supply-chain question, and none of them contains client data.
A supply-chain control tower for a fictional footwear brand: stock coverage, inbound orders, demand and stress tests, with every figure checked and traceable.
Open the live demo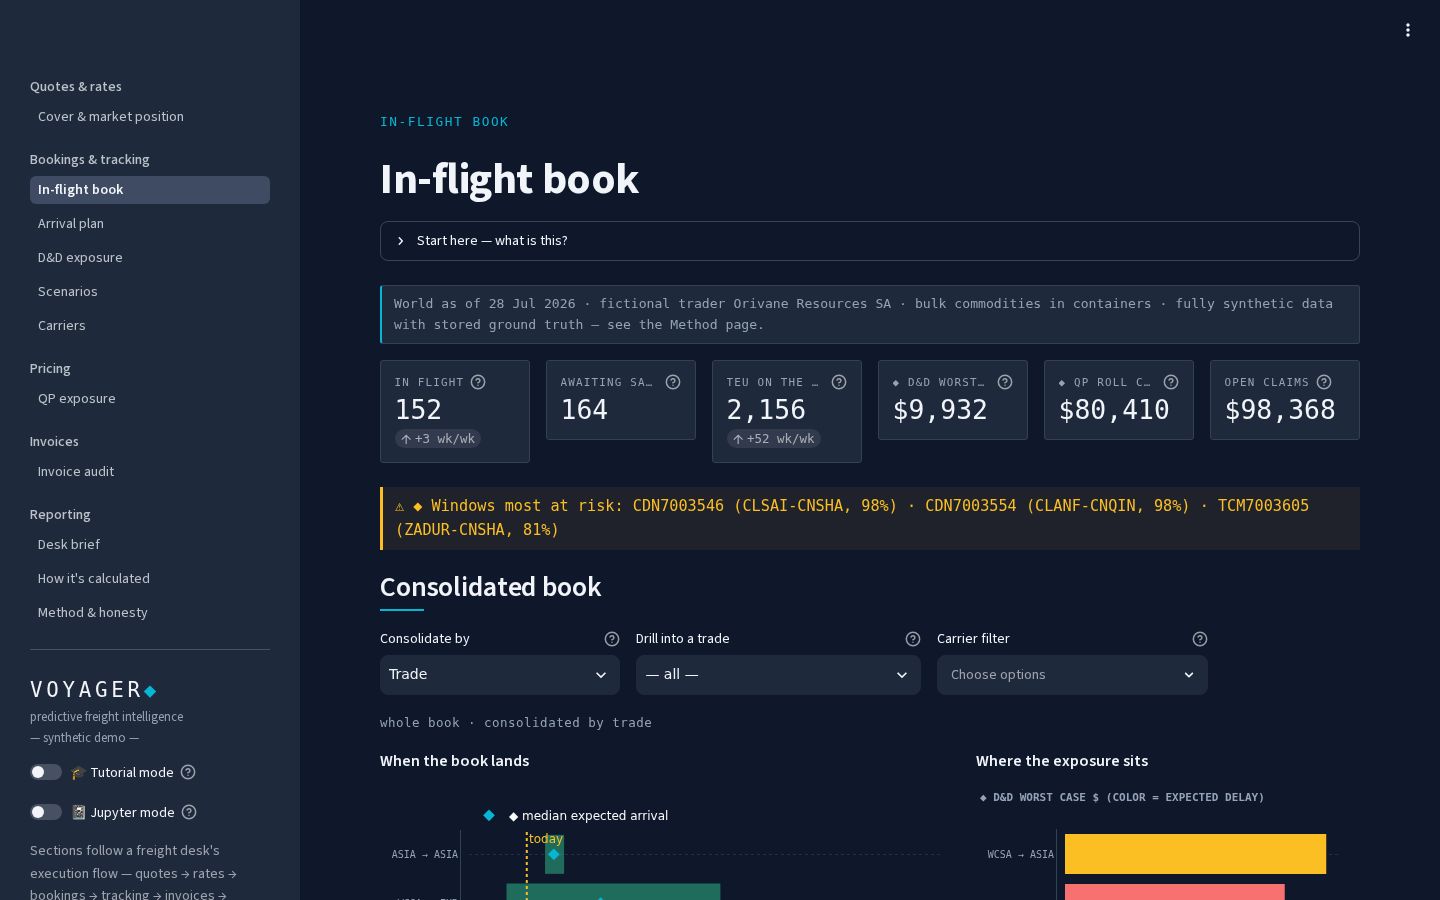
Freight intelligence for a fictional importer: arrival ranges, demurrage and detention exposure, carrier scorecards and an invoice audit.
Open the live demo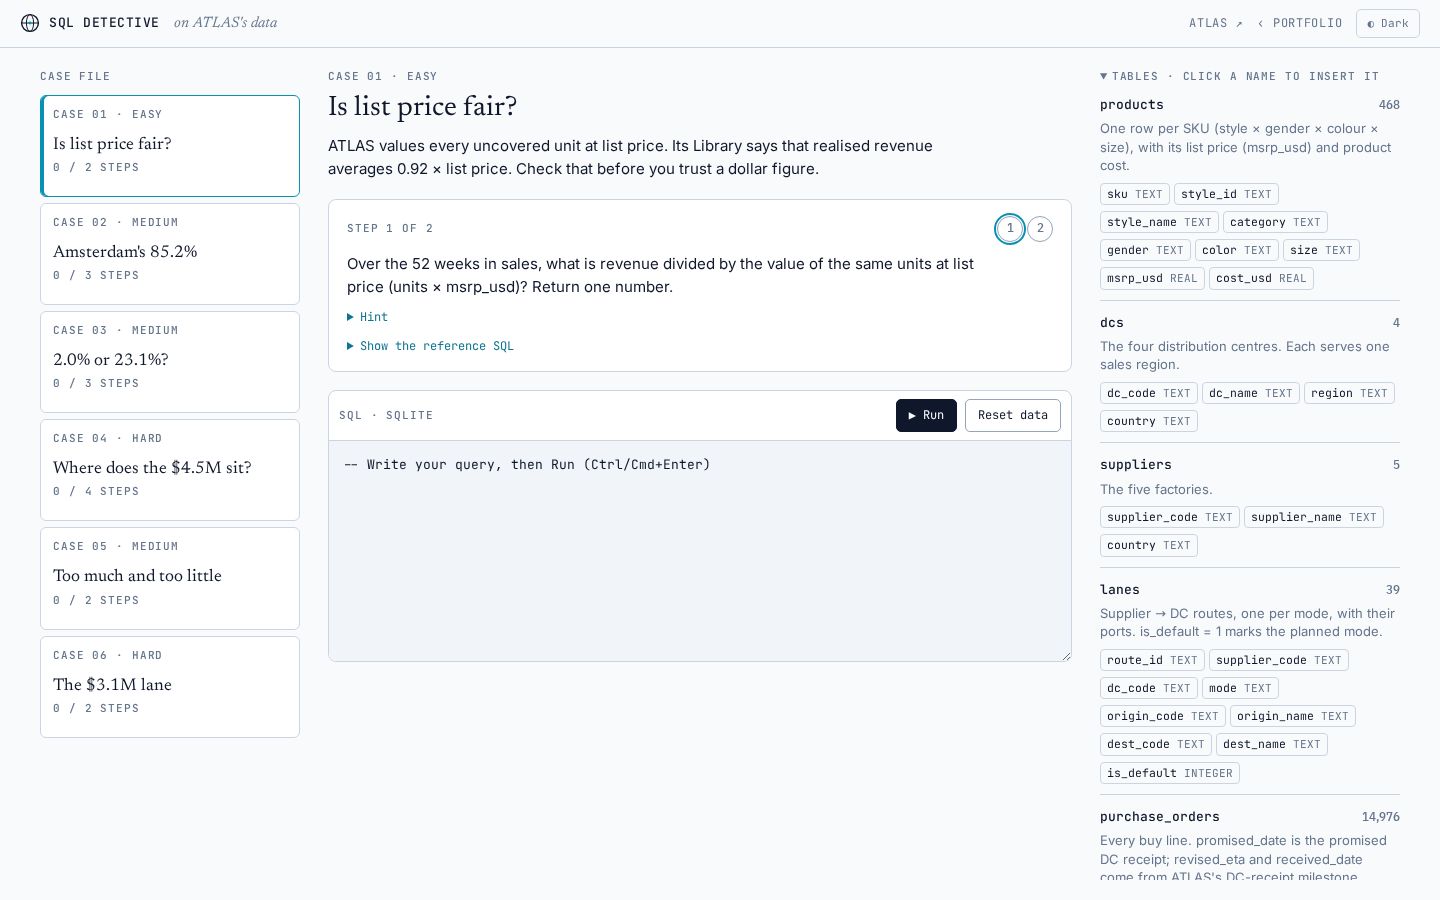
Six cases built on ATLAS's data. Rebuild each headline number in SQL, in the browser, and check it against ATLAS.
Open the live demo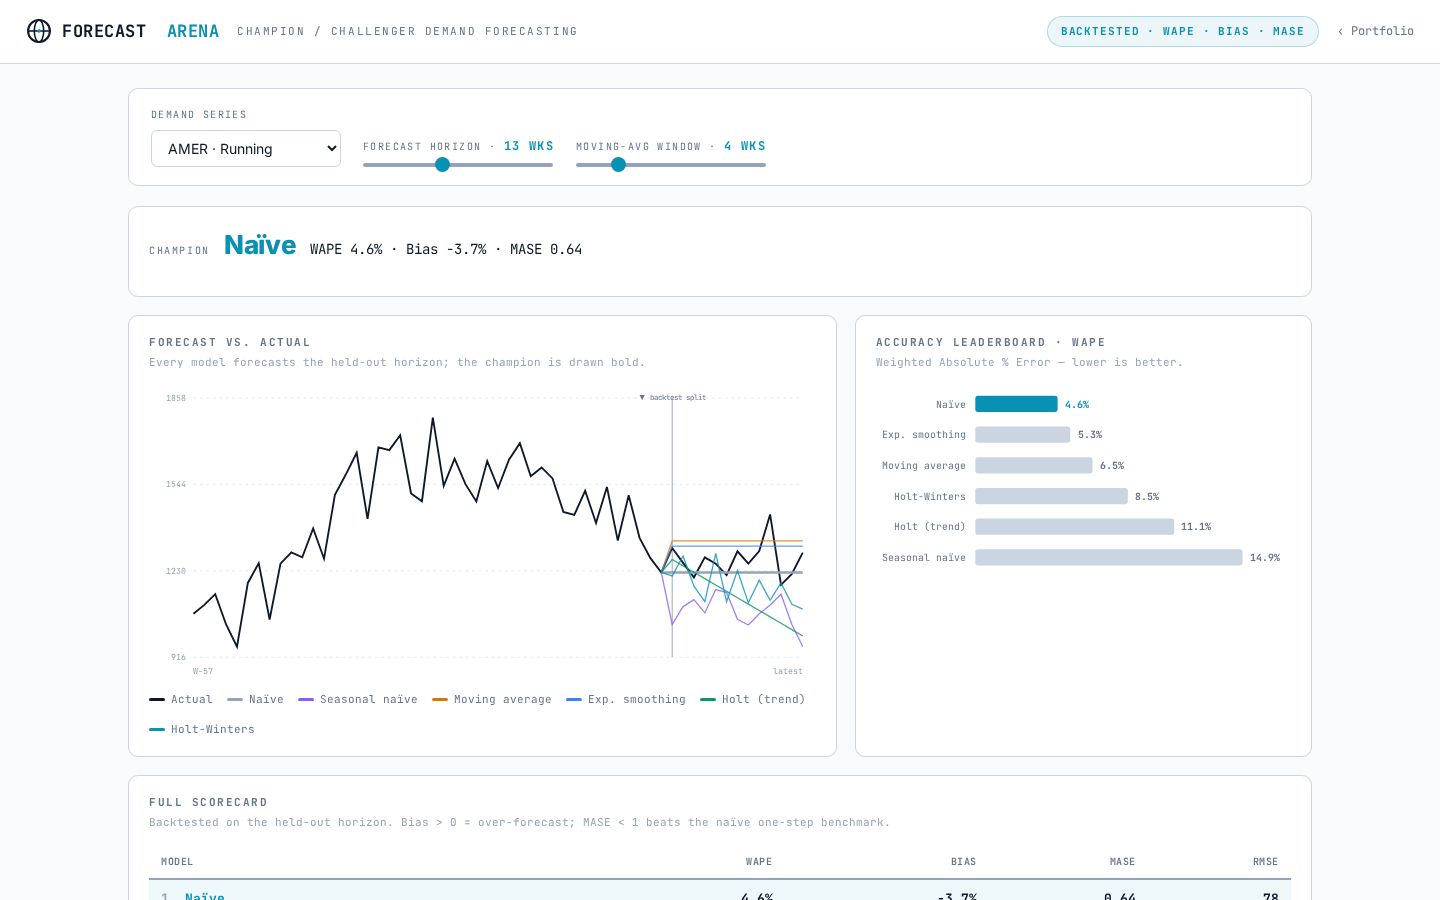
Six forecasting methods tested on the same demand history and ranked by forecast error. Which method wins depends on the series.
Open the live demo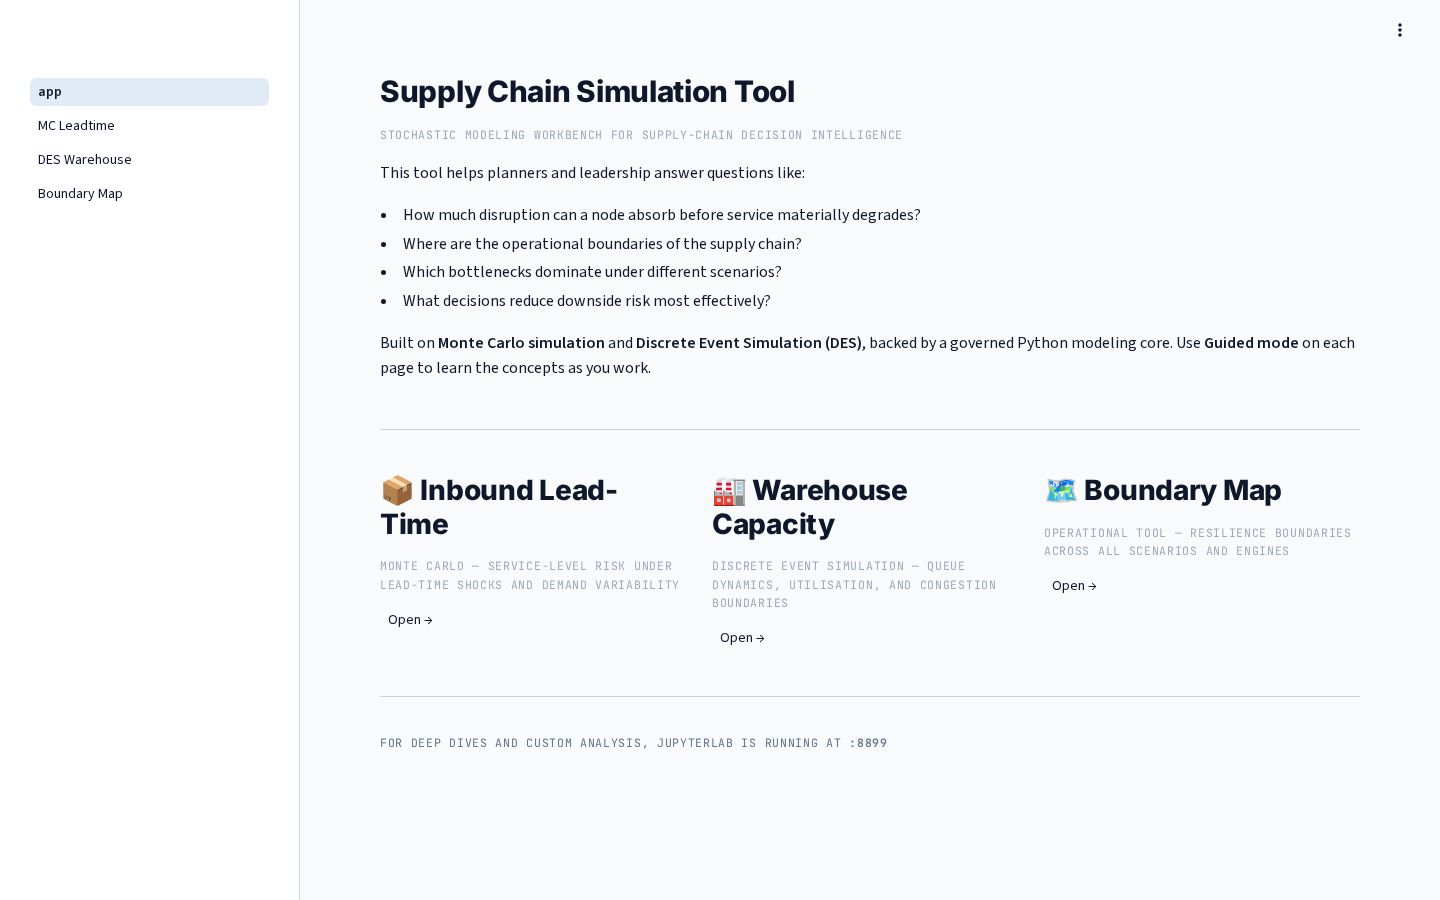
A warehouse and network simulation that injects disruptions, such as a port closure or a demand spike, and shows where the system starts to fail.
Open the live demo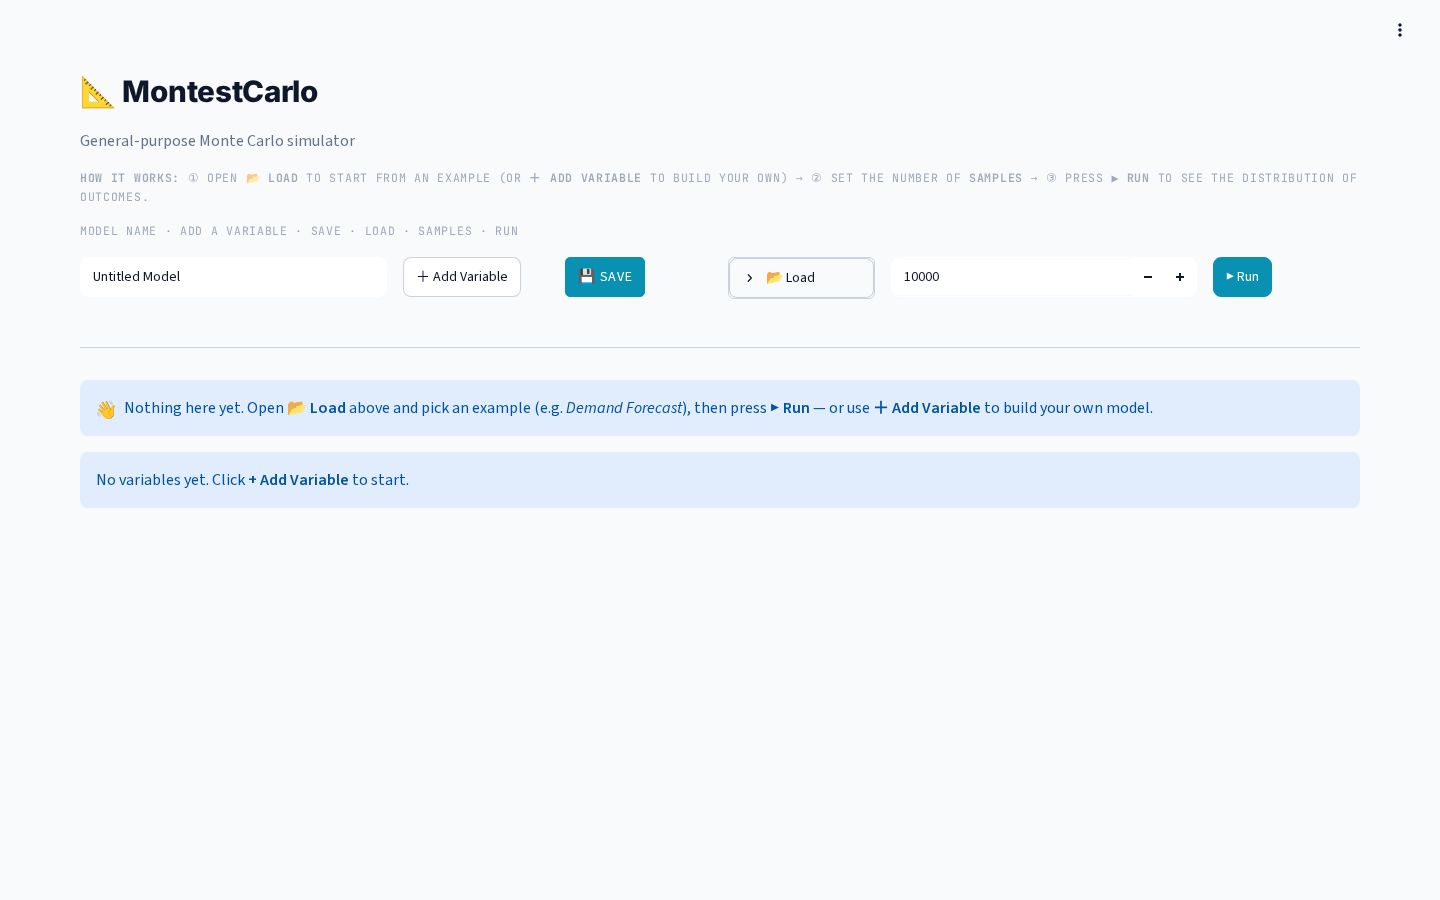
Build probability ranges for lead times, yields and transit times, and see which uncertainty drives the result.
Open the live demoSmall tools, each answering one freight question with a worked example.
Book against the transit percentile that actually holds, not the average.
You negotiated -8%. You paid +3%. Here is where it went.
Your 0%-on-time carrier may be the only one you can plan on.
Your carriers have pricing personalities. Negotiate accordingly.
Your building has fire drills. Your supply chain doesn't.
Air freight isn't your failure mode. It's your best decision, made too late.
The typhoon closed the port for two days. The queue lasted a week.
The nearest plant is the right one to ship from, until the month capacity runs out.
Want something like this built on your own data? Write to me at [email protected].